The potential for errors exists after migrating or instrumenting Google Analytics (GA4) or another analytics vendor. There is a risk of inadvertently leaving or adding your live/production GA4 tracking script on your staging domain or a domain that you want to avoid being included in the data collection for that specific Google Analytics property. So, how can you determine if you've made this mistake? Or let's rephrase the question by asking how you can identify which domain you're collecting data on.
In this concise and informative article, we will create a page hostname report in Google Analytics. This report will assist you in the following ways:
- Gain insights into the domains from which the Google Analytics site is collecting data.
- Identify if any domain is not collecting data when it should be.
- Obtain a high-level understanding of the performance of your various business domains based on aggregated metrics.
- Detect whether you are collecting data on your website's staging domain, from a spammy website domain, or from a business website domain you do not want to be included in your data collection strategy, which can be tied to your own specific reasons.
- Lastly, confirm that everything is in order regarding the hostnames on which your business's Google Analytics is implemented.
How To Build Hostname Performance Google Analytics Standard Report
Now, let's take a look at how to create the report. It's straightforward, and here's how you can do it using a pre-existing standard report in GA4.
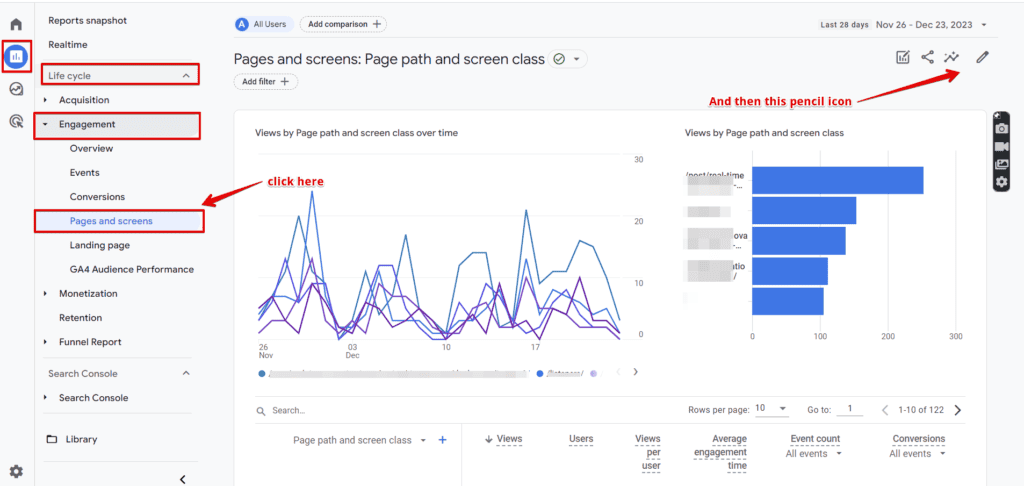
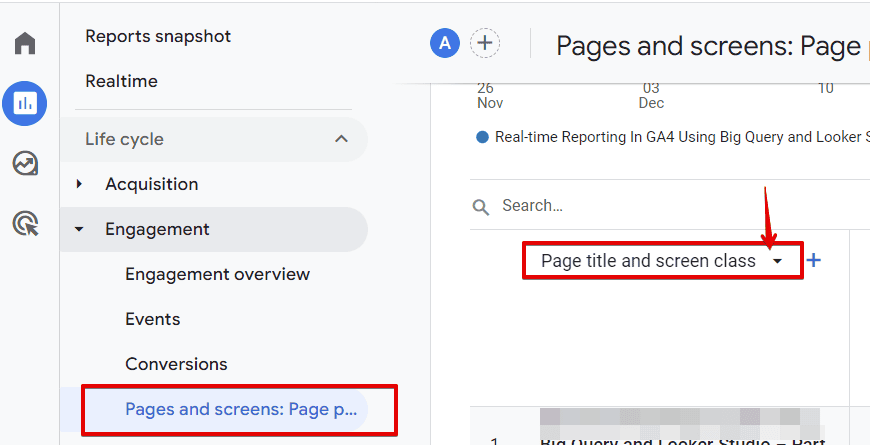
Navigate to the “Reports” section of your Google Analytics property. Locate the “Pages/Screens” report, which by default resides in the “Engagement” topic under the “Life Cycle” report collection. While in the report, click on the “pencil” icon to initiate customisation.
Alternatively, If, on the other hand, you initially configured your GA4 property with a distinct objective that ultimately necessitated the restructuring of your GA4 report, you can locate it within the “Pages and Screens” report under the “Examine User Behavior” topic within the “Business Objectives” collection.

If you're unable to locate it, don't fret. You have the option to create one from scratch, and later in the blog post, I will also guide you through the starting steps of this process.
Select the “Dimensions” option within the report customisation view under “Report Data.”
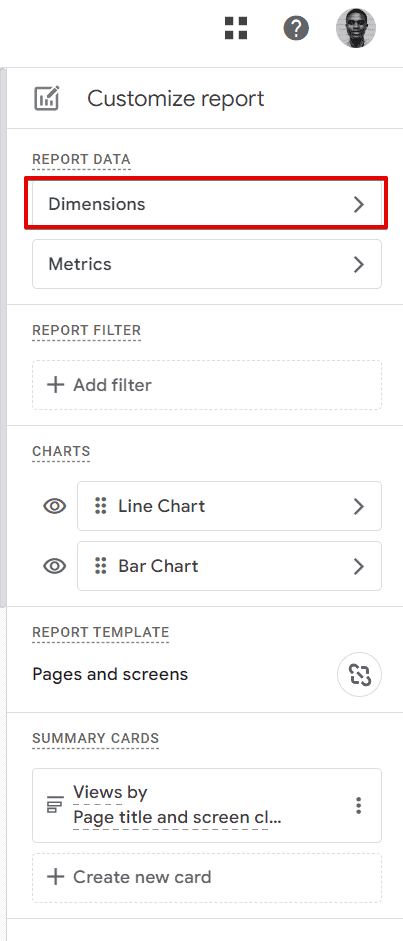
This will display the number of dimensions used for that report. The next step is to click on the “Add Dimension” dropdown.

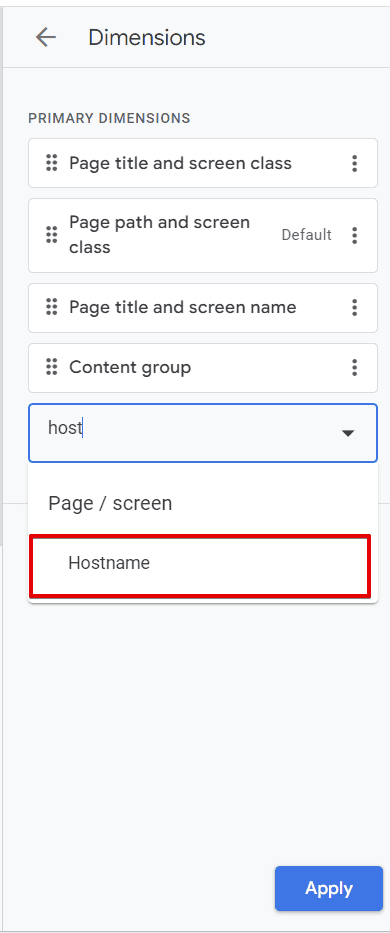
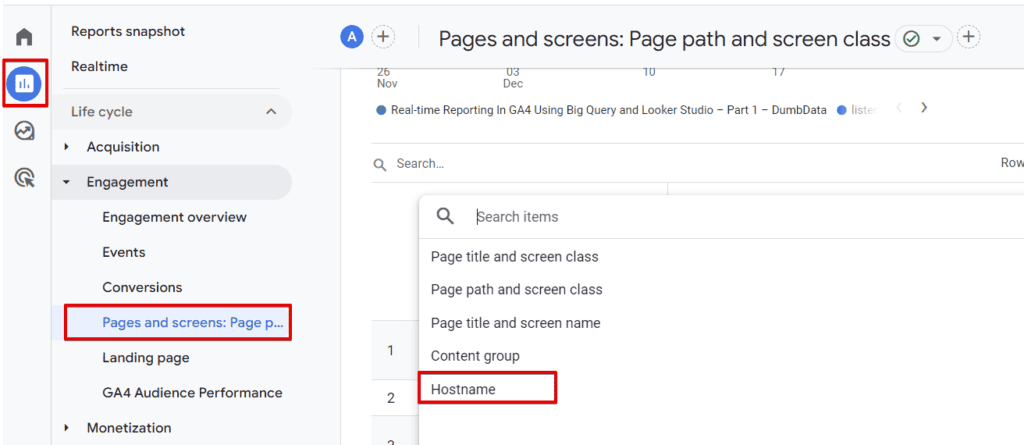
Search for the “Hostname” dimension and choose it.
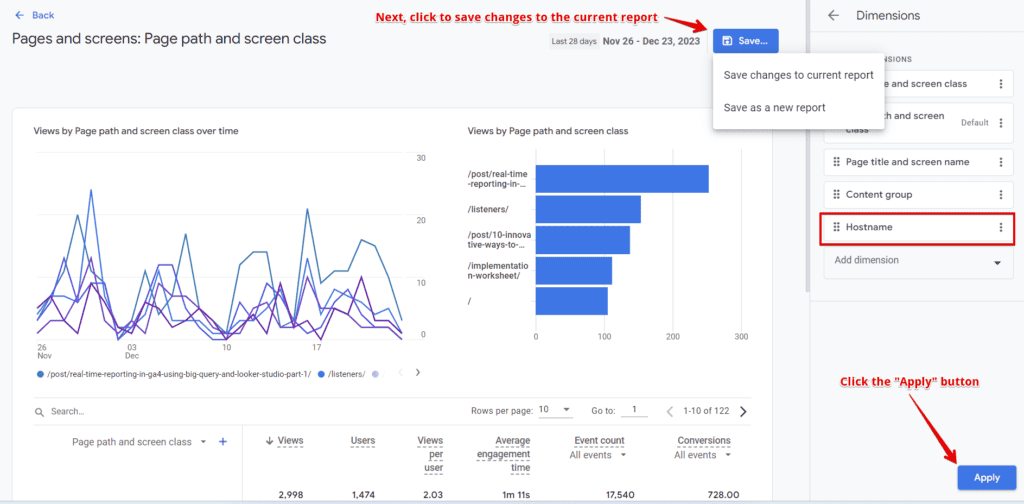
If your goal is not to create a new report but to understand performance across different business domains, you can simply leave the hostname dimension selected. Click the “Apply” button, followed by the Save button, to save the changes to the current report.
In the next screen, you’ll be saving the report changes and updating the report in the specified collections. Also, note that the updates in published collections are visible to all users.

This allows you to include the “Hostname” dimension in the same “Pages and Screen” GA4 report. And you can do that in these easy steps.
While on the same pages and screens report, click the dropdown to change to the “Hostname” dimension.
In the dropdown, select the “Hostname” dimension that you added earlier.
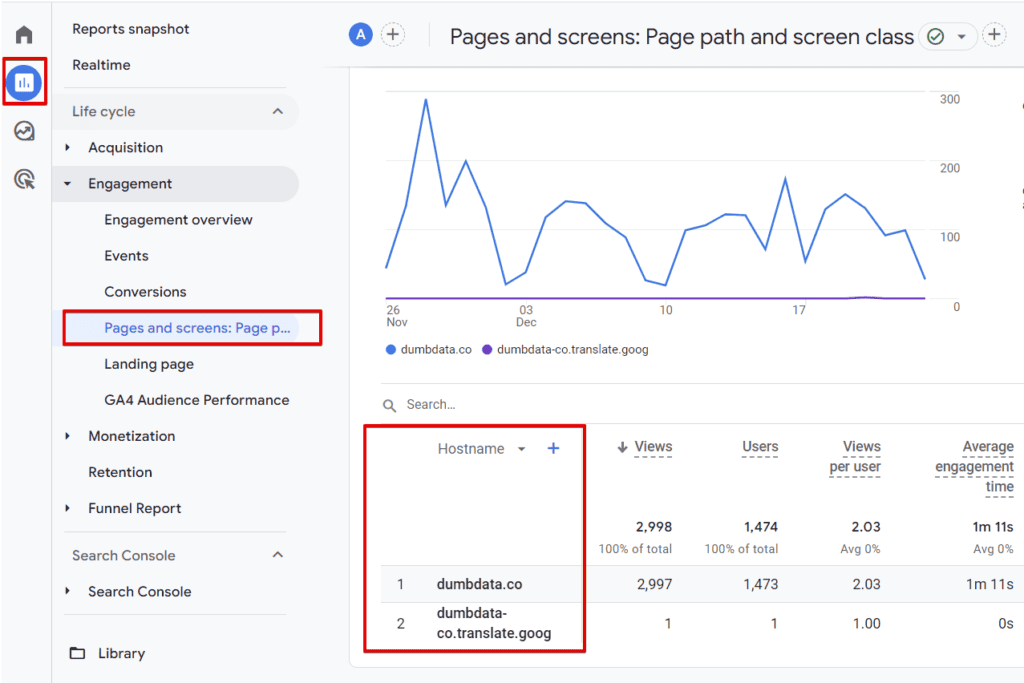
You should now have your page hostname performance report in Google Analytics.
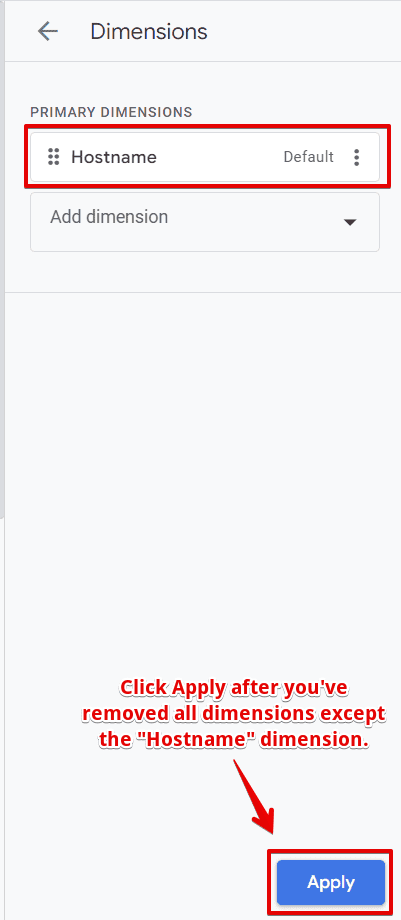
However, if you wish to create a separate report, you'll need to remove all the existing dimensions, leaving only the “Hostname” dimension.
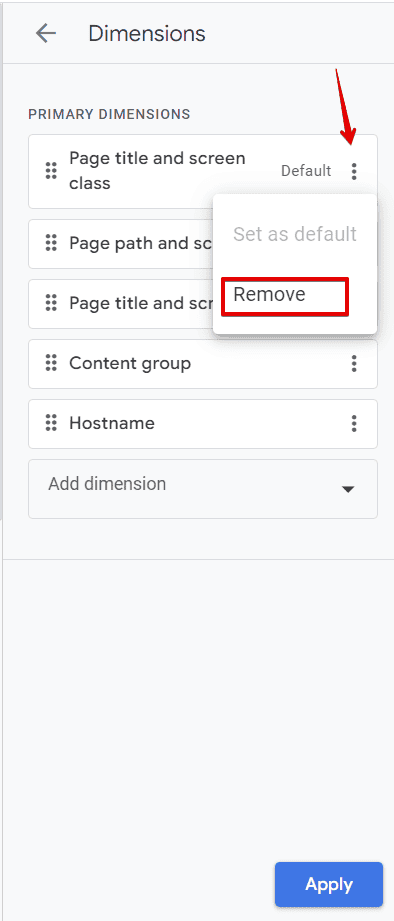
Click the “Apply” button after you’ve removed all dimensions that exist in the report except the “Hostname” dimension.
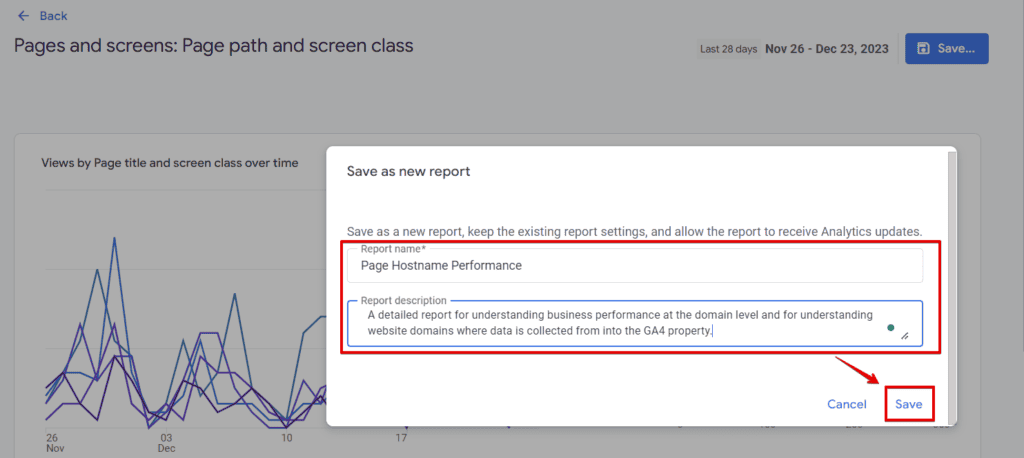
Click the save button and select “Save as a new report.”

Provide a name for the report and an optional description.

After providing a name and an optional report description, click the save button.
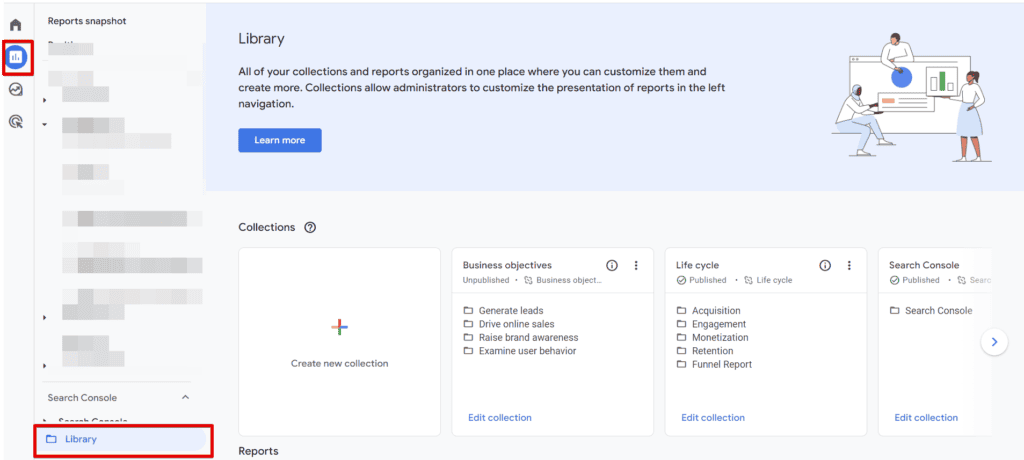
The next step in the process involves adding this report to our report collection. To accomplish this, navigate to the “Library” collection from the reports view by clicking the folder icon.

Select the appropriate collection where you want to add the report. Then, click the “Edit Collection” button or the three-dotted icon and choose “Edit.” In my case, I will opt to edit the “Life Cycle” collection.

Drag the website domain performance report that you've created to your desired “Topic” within the collection. Alternatively, you can create a new topic specifically for this report. For instance, in this article, I will add it to the “Engagement Topic“, which is a system topic.
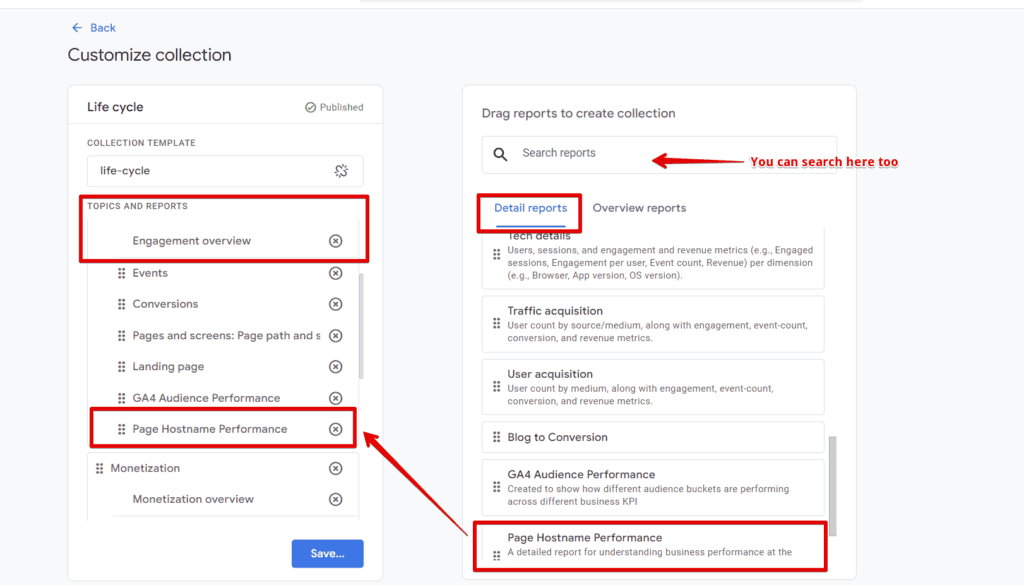
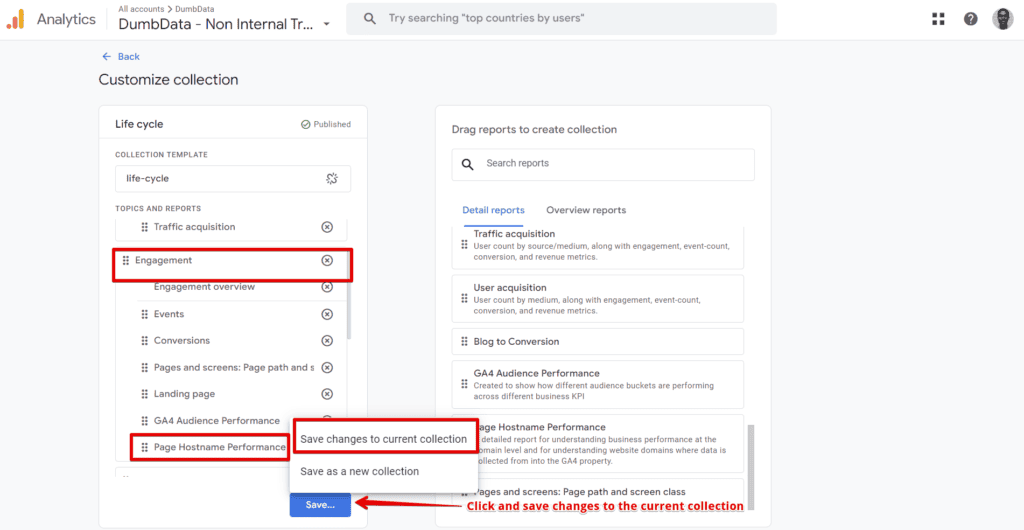
After dragging the “Page Hostname Performance” detailed report to the “Engagement” topic under the “Life Cycle” Collection, click the “Save” button.
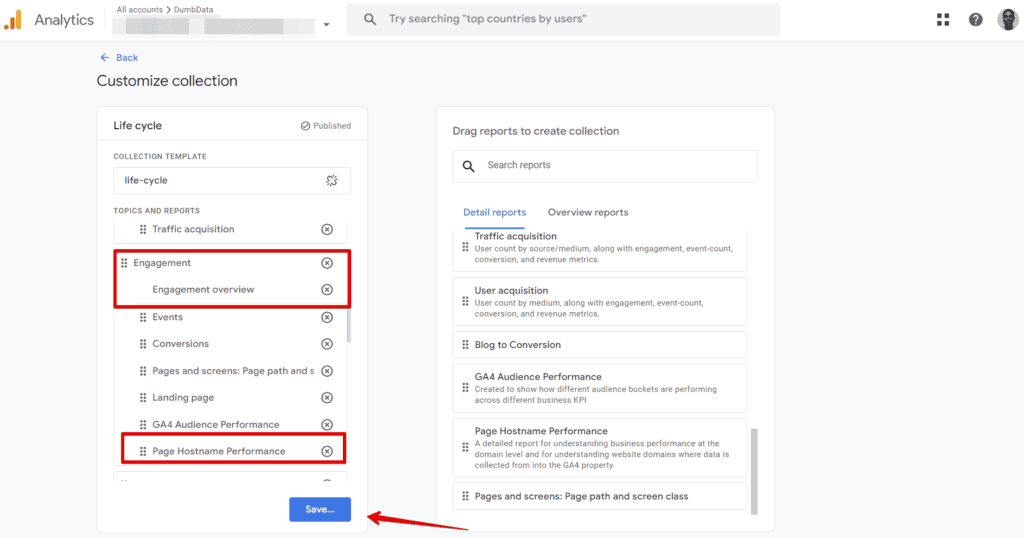
Once you have placed the report in the desired topic, click the “Save” button and select “Save changes to the current collection” to publish it for all users of that GA4 property.
After that, you can hit the back button to return to the standard reports section of Google Analytics.
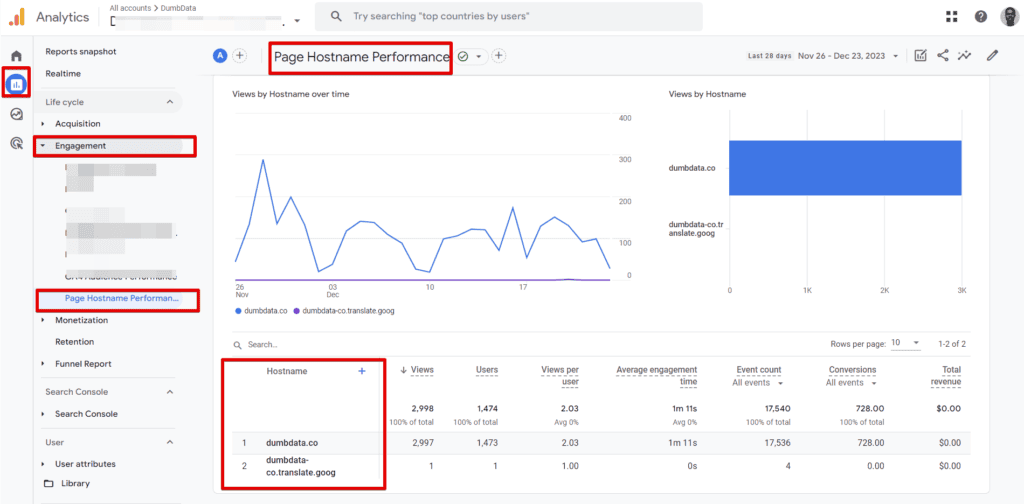
Completing the outlined steps will add a new and separate standard report in Google Analytics (GA4) property, assisting in identifying the domains from which your business is collecting data.
Now, you can conveniently access the “Page Hostname Performance” report you built directly within the GA4 standard reports collection, situated under the collection and topic to which you added yours.
Creating The Report From Scratch
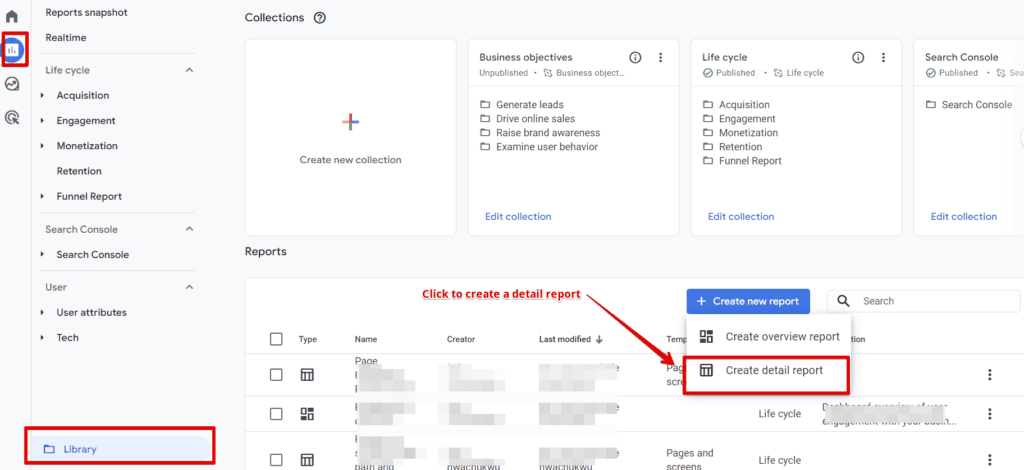
In a scenario where you were unable to locate the report template we utilised, and you wish to develop the hostname standard detailed report in your GA4 property, you can accomplish this directly from the “Library” interface.
Click the “Create New Report” button and choose the “Create Detail Report” option.
Within the report build interface, opt for the “Pages and Screen” template and follow all the previously discussed steps to formulate your report.

Using GA4 Exploration To Report On Hostname Performance & Data Collection
Lastly, if you need to create an exploration, it's also feasible. Navigate to the newly created report, click the “Edit Comparison” icon, and then select the “Explore” button.

The report will be automatically generated as an exploration report for you in GA4, as shown in the image below. Note that you’ll be presented with the screen below, and just click got it option.
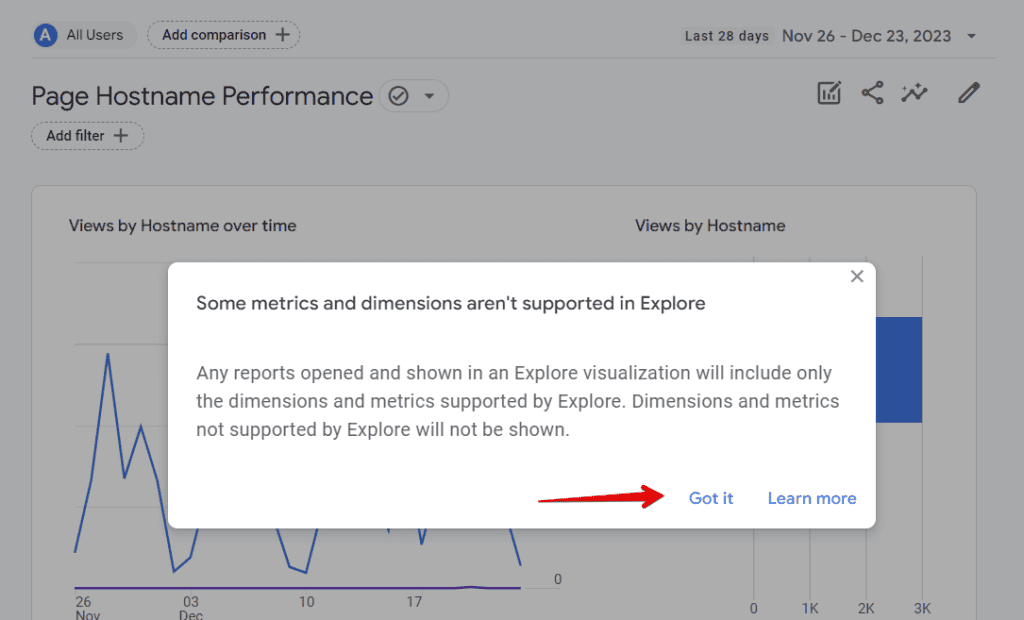
You will then have Google Analytics autogenerate the exploration for you.

Closing Remarks:
As mentioned earlier, this article is concise yet has demonstrated how to create a detailed hostname report. It has also looked at how this report can be beneficial and the insights it can offer an analyst.
I would appreciate hearing whether you've successfully created this report and your thoughts on its utility. Until then, HAPPY measuring!
About the Author
Jude Nwachukwu is an analytics specialist working with businesses across diverse industries in Africa, Europe, and North America. His passion for writing and assisting non-technical marketers to thrive in the ever-evolving realm of analytics gives him great satisfaction. He co-founded a measurement resource hub called DumbData.