
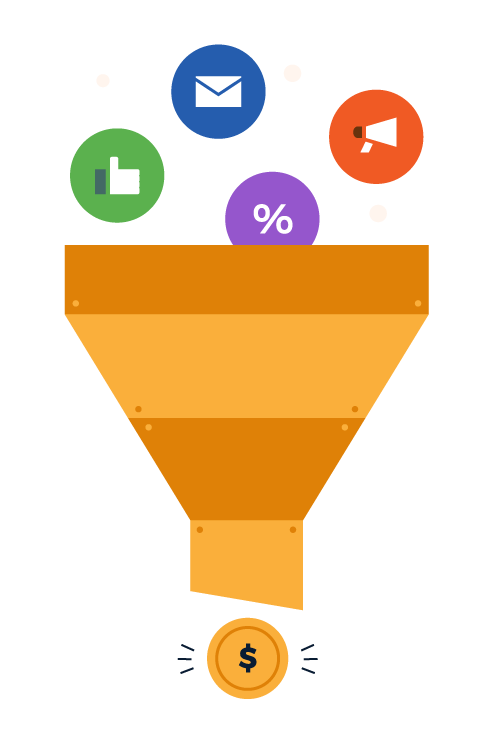
You have a funnel, whether you know it or not.
The question is, “How do you know your funnel is working?” Where can you go to see where customers are leaving you and why they’re going?
Many landing page builders, like Clickfunnels or LeadPages, show you your numbers per page. You can see the number of visitors and conversions.
But do you know why they converted? More importantly, do you understand why some didn’t convert?
Google Analytics, when set up correctly, can tell you everything you need to know to optimize your sales funnel.
Let’s find out how.
Funnel Basics
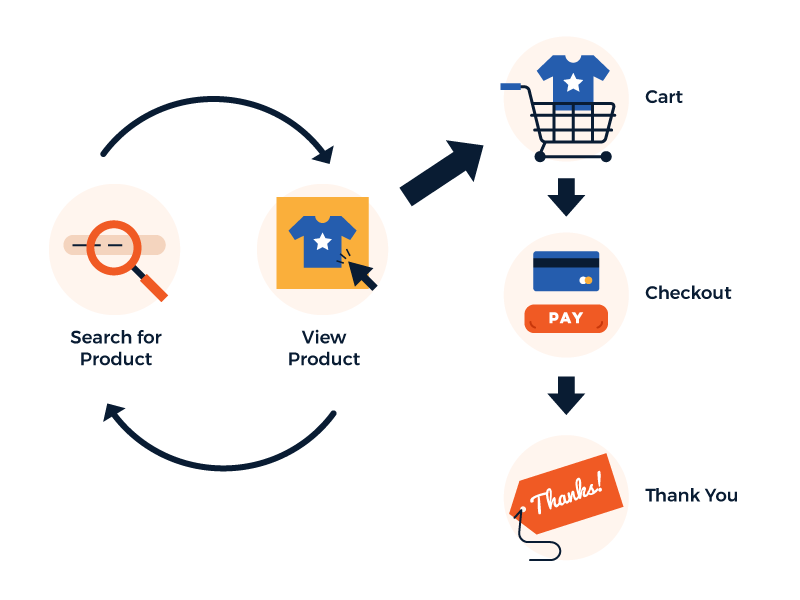
The customer takes a journey from being unaware of you and your products or services to become a loyal customer who recommends you to others. There are several stages of that journey.
For some industries, such as e-commerce, customers don’t have a linear journey that’s easy to track. But there is a journey.
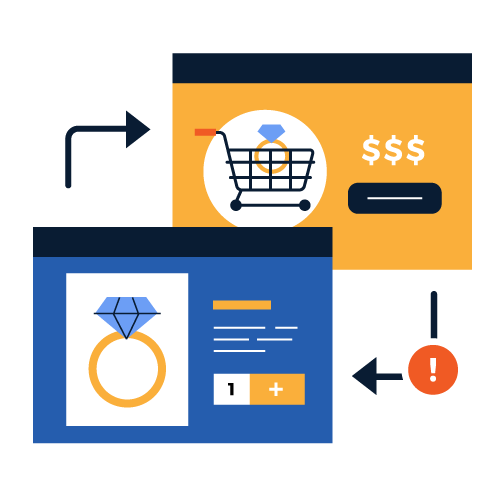
Customers will see a product detail page. They may view a category page. From the product detail page, they add to the cart. From the cart, they start and then complete the purchase.
Another style of the funnel is becoming aware of your brand, engaging with your brand, becoming a lead, then purchasing your product. There may be an information product for sale and a sales letter using direct response copywriting to sell it.
The customer journey is different for every business. Some businesses expect their customers to click on a paid ad and instantly buy the product. Other companies may create an email list and nurture the lead until they purchase. Companies servicing large enterprises may have sales cycles that run several months to a year.
No matter how many steps your customer journey contains or how long it takes a customer to traverse it, you need to know how your funnel works and where you can optimize it.
That’s where Google Analytics fits in.
Funnels Within Google Analytics
There are two funnel reports in Google Analytics that can provide insight into how your users are interacting with your sales funnel.
First up is the Funnel Visualization report. You can find this report under Conversions -> Goals -> Funnel Visualization.
The primary purpose of the funnel visualization report is to tell you how many users made it from step 1 to step 2, then from step 2 to step 3. It’s a simple report, but it gives you a nice visual so that you can see your numbers at a glance.
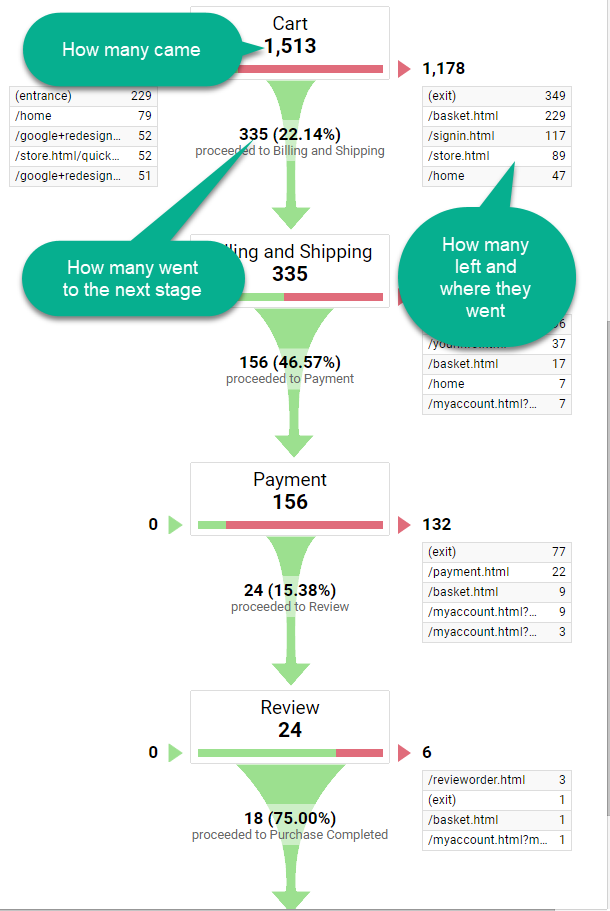
The number underneath the funnel stage is how many made it to this stage. The figure below is how many went to the next step. The incredibly helpful table to the right shows you where those who didn’t move to the next stage went instead.
The most important question to ask when looking at the funnel visualization report is, “Does that make sense?” You should know what numbers are typical for your industry so you can tell where your funnel is having trouble.
For example, if you expect a 65-75% cart abandonment rate, but you see 87% or 90%, you know what part you need to optimize. Something is going wrong at the cart phase.
Ultimately, you want to know what percentage of people finish the process who begin the process. The funnel visualization report helps you to find significant leaks in your funnel.
The second helpful funnel report in Google Analytics is the goal flow report. You can find this in Conversions -> Goals -> Goal Flow.
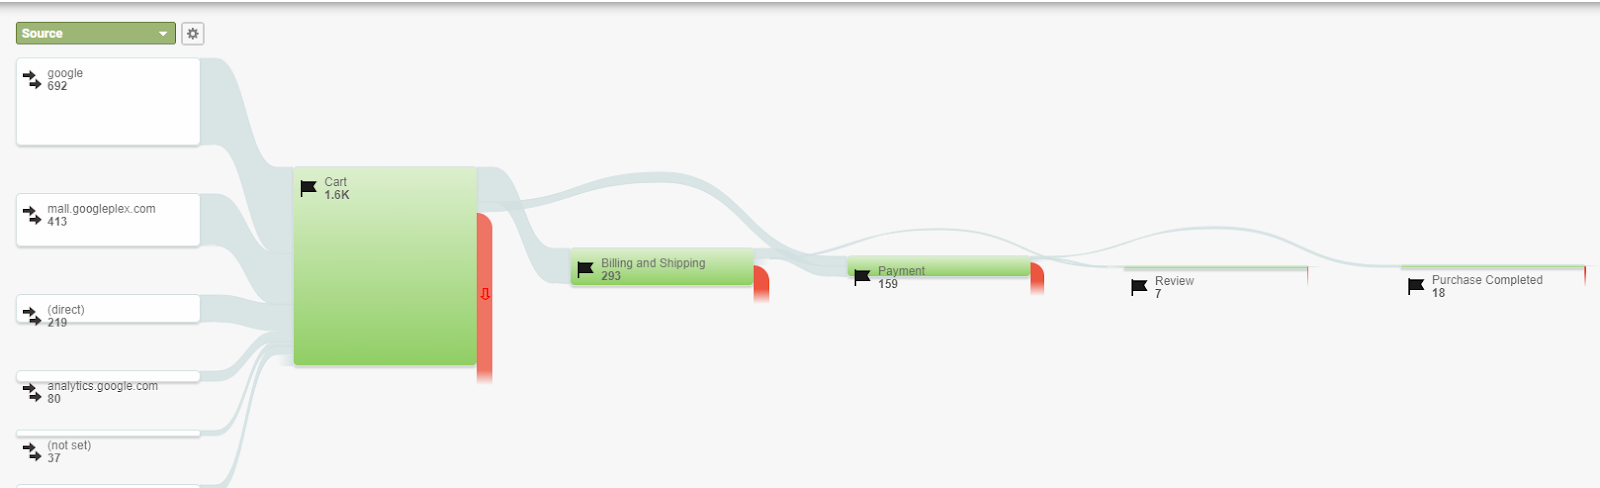
The goal flow report shows you the same steps as the funnel visualization report. However, it shows you slightly different information about those steps.
You won’t easily see the conversion rates within the visualization, but you’ll be able to see the flow of traffic from one stage to another. You’ll be able to see whether some users skip steps on the way to purchase.
In our example screenshot above, you see that some are skipping the shipping and billing step and are going directly to payment. You may see this behavior from logged-in users. But if your website doesn’t have a login feature, there may be something wrong.
When used in conjunction with the funnel visualization report, you can find all of the answers you need to optimize your sales funnel.
Case Study: Fixing A Sales Funnel Using Goal Flow
We recently had a client who was experiencing a cart abandonment rate of over 90%. The flow went from a sales page to the cart for the user to purchase. The goal flow report gave us the information we needed to fix the problem.
We noticed a large number of loopbacks from the cart to the sales page. The users were navigating to the cart, then abandoning it, going back to the sales page. After we investigated, we found the culprit.
The price of the product was not on the sales page. It was only viewable on the cart. Users were navigating to the cart to see the price, not to purchase the product.
Once we added the price to the sales page, the cart abandonment rate dropped like a rock, down to 60%.
The most important part of the sales process is to reduce friction for the user. Use the funnel visualization and goal flow reports in Google Analytics to find the rough spots and smooth them out.
How to Track Your Funnel in Google Analytics
The first step to using Google Analytics correctly is to plan. Don’t jump into analytics and try to dig for information.
We prefer to use the A.C.E. Model when planning funnel buildouts in Google Analytics. A.C.E. stands for Aware, Complete, Engage. These are the basics steps in every funnel you need to measure.
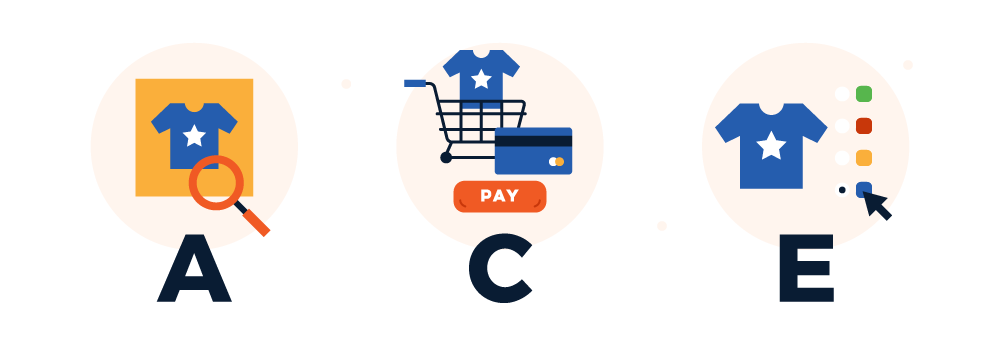
- Measure Awareness – Are users aware of the process?
- Measure Completion – Did users complete the process?
- Measure Engagement -Did users engage at every stage on the way to purchasing?
(NOTE: Need help with setting up your A.C.E. Goals? Get a copy of the A.C.E. Goals guide as part of your Free Toolbox Membership!
Let’s use MeasurementMarketing.io as an example to illustrate the A.C.E. Model.
For us, the W.I.N. course page is the point at which we say a user is aware of our offering. When a user visits this page, we say they’ve become “aware”.
When you scroll down on the W.I.N. course page, you’ll see a button to learn more about W.I.N. Monthly Pass, where you can access all of our W.I.N. training courses.
When someone clicks that button and navigates to the W.I.N. Monthly Pass checkout page, we count that as a user engaging with our content. They’ve reached the “engagement” goal.
The next step is our checkout page, where we ask for a commitment on the part of the user.
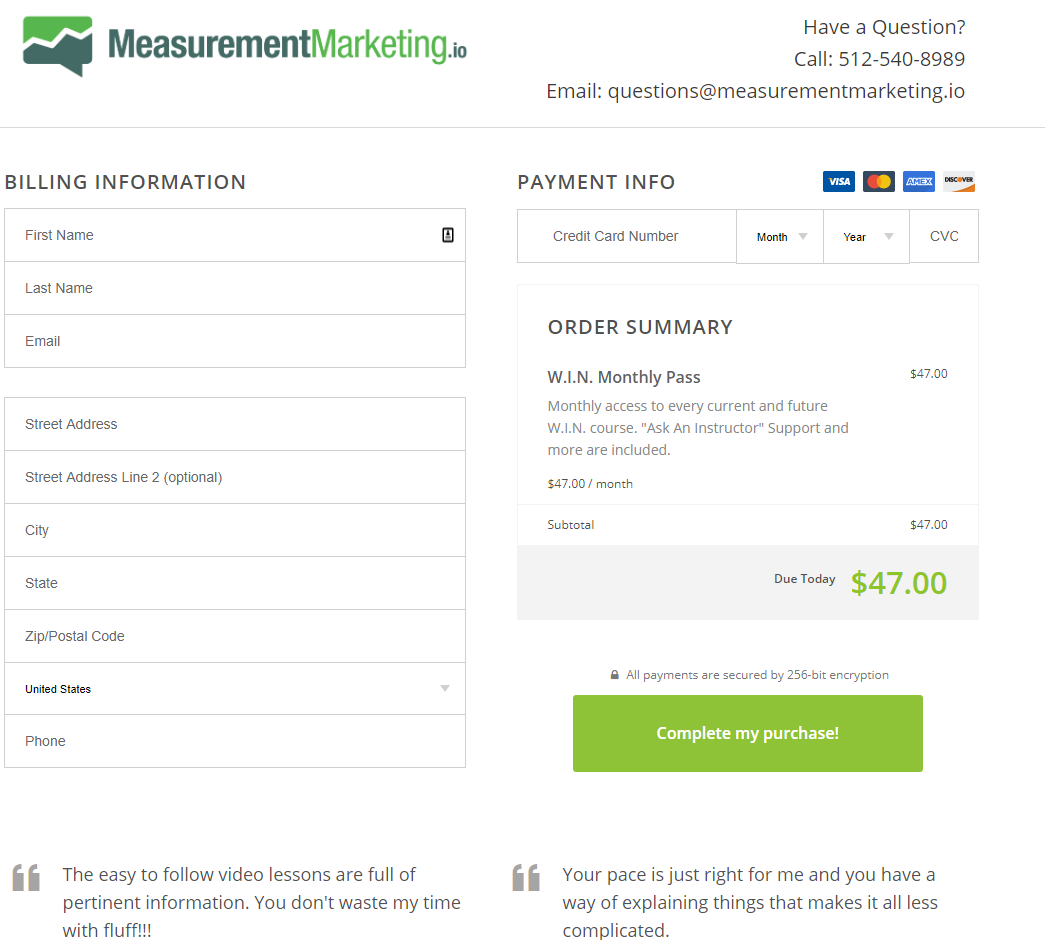
Once they put in their payment information and click “Complete my purchase!”, they view the thank you page. We count users who’ve seen the thank you page as having “completed” the funnel.
You can build your funnel in the same way. Keep it simple at first.
Creating Funnel Goals Within Google Analytics
Our W.I.N. Funnel Tracking course goes into detail about how to create your funnels in Google Analytics. Check it out for more information.
In the meantime, here are the steps to help you get started.
Within Google Analytics, navigate to Behavior -> Site Content -> All Pages. This report will tell you the URL of the pages your users are visiting. Grab the URLs of the pages that you want to track as your funnel.
Once you have the pages, set up destination goals for each of these URLs. You can use a part of the URL to make it easier. Just look for the part of the URL that never changes (take out any parameters).
PRO TIP: Google Analytics doesn’t store the “http://” or the “https://” at the beginning of URLs. If this is present in your goal, the goal won’t fire.
On the goal page, you’ll see a button called “Funnel.” Click that button to turn the goal into a funnel step, which will make it appear on the funnel visualization and goal flow reports. Enter a step name and the page you want to use to indicate a user has reached this stage.
Once your funnel goals are set up (according to your A.C.E. goals), your funnel reports will be up and running.
Over time, you can improve your skills and introduce more advanced methods, such as measuring clicks and how far down a page a user scrolls. We’ll cover these techniques in another post.
The Benefits of Tracking Your Sales Funnel in Google Analytics
Using Google Analytics to track your sales funnel gives you a holistic view of your customer’s journey in one place.
You see where users come from, where they go if they leave, and whether they engaged on the way to purchasing your product.
You don’t have to export analytics from other sites, like Facebook or LeadPages, to cobble together custom reports once a month.
Instead, check out our W.I.N. Funnel Tracking Course to learn how to plan your Google Analytics build to make the most out of the sales funnel visualization tools. Learn, in real-time, what path users are taking through your funnel.
Don’t make dangerous assumptions. Trust, but verify. When you understand how your funnel works, you know how to make it better.
(NOTE: Need help with setting up your A.C.E. Goals? Get a copy of the A.C.E. Goals guide as part of your Free Toolbox Membership!