For many marketers, there’s no better feeling than seeing “good” numbers. That may be traffic going up, costs going down, or any combination of numbers.
Marketers tend to live in a world of numbers. But numbers don’t show the whole story. And when you don’t measure everything you can, your numbers could tell you an incomplete story.
Business owners have to know the complete story to make the proper decisions. That story can be challenging to come by. We’re here to help.
Let’s take a look at how to know, not only if you’re successful, but why you’re successful.
It’s all a part of the story Google Analytics is telling you. However, numbers don’t always tell you the truth.
Numbers suck.
Why Numbers Suck…
Numbers aren’t useful in small groups. Such groups create huge swings, so the information isn’t as useful as it should be.
For example, your cart abandonment rate could be 80% one day, 70% the next day, and 60% the day after that. You can’t make any meaningful decisions based on massive changes.
Numbers get more useful when there are more numbers to use. The numbers you see in Google Analytics will never be accurate. But that doesn’t mean they’re not helpful.
The truth is in the trend. The power is in the pattern. Gather enough data, so you see behaviors that allow you to make decisions.
For example, you don’t need to know that exactly 93 people bought your product. What you do need to see is that 25% of the people who visit a particular page purchased the product.
No matter what the actual numbers are, the patterns and trends will allow you to make the right decisions.
A Particularly Difficult Metric – Lifetime Value
Lifetime value, or LTV, is a standard metric used to gauge how valuable each customer is during their relationship with a business.
LTV is also an example of the types of numbers that can get you into trouble. Many business owners use it as a shortcut to profits, but it doesn’t always work that way.
Let’s walk through a scenario…
You calculate your LTV one day, and it is $1,000. You also see that it takes $100 to get a customer. You’re making $900 per customer!
Once you complete dancing around your office, you quickly borrow $10,000, so you can get more customers. Then you wait for the cash to come rolling in.
You have to take into account time and distribution. How is that revenue coming to you? When does the money reach your bank account?
You may find that one client after nine months bought a $50,000 product and skewed your LTV. Most other customers pay $25 or $50 for widgets.
Misapplying LTV may lead you to be cash poor and losing money.
Instead, measure the velocity of return. Measure your LTV at zero, seven, 14, 30 days, and so on. You’ll get that $1,000 per customer, but you’ll also know when that $1,000 comes back to you.
The Dirty Little Secret That Changes Everything
Want to know a secret that changes the way you think about analytics forever?
The numbers don’t matter.
People do!
Just kidding.
Behaviors matter.
The behaviors of your visitors show you the story of whether you’re successful and why you’re successful.
Behaviors leave numbers behind, so many marketers focus on the numbers instead of the actions that caused them.
(NOTE: Need help with measuring your prospect's and customer's behavior? Get the Marketing Behavior Toolkit inside as part of your free “Toolbox” membership to ensure you're sending the Right Message To The Right Person At The Right Time. The toolkit includes: the Behavior Blueprint, Behavior Maps, examples, and actionable insights.)

Imagine driving down the road and suddenly…
Your car sputters to a stop. You ran out of gas. Your gas gauge is showing the number zero, as in zero gallons of gas left.
If you focus on the number, you’ll get angry at the car for having terrible gas mileage. But what if you focused on the behavior?
Two numbers together, the number of miles driven and the amount of gas left, tell the story that maybe your foot is a bit too heavy. That’s the behavior at the source of the numbers.
With that knowledge, you begin to drive slower and less recklessly after filling up, of course, and the next tank of gas lasts much longer.
Focusing on the behaviors led you to make a meaningful change.
Now that your actions have changed, you’re saving money on gas.
Visitors may be exhibiting behaviors you don’t want. Maybe they’re going to the wrong cart page from the wrong sales page. Or they may be leaving the cart page before buying. These are the behaviors that lead to meaningful change.
The number of people who land on the cart page doesn’t matter. You want to make sure they arrived from the place you want them to and that they complete the purchase once they get there.
Look, not only at the final result but all of the little achievements that have to happen for the end “big result” to occur. It’s like a row of dominoes that has to fall one-by-one in a particular order.
When you look at all of the “dominoes,” you’ll know why things are working, or why they aren’t working.
Answer the Right Question

Storytelling in Google Analytics is about asking the right question(s).
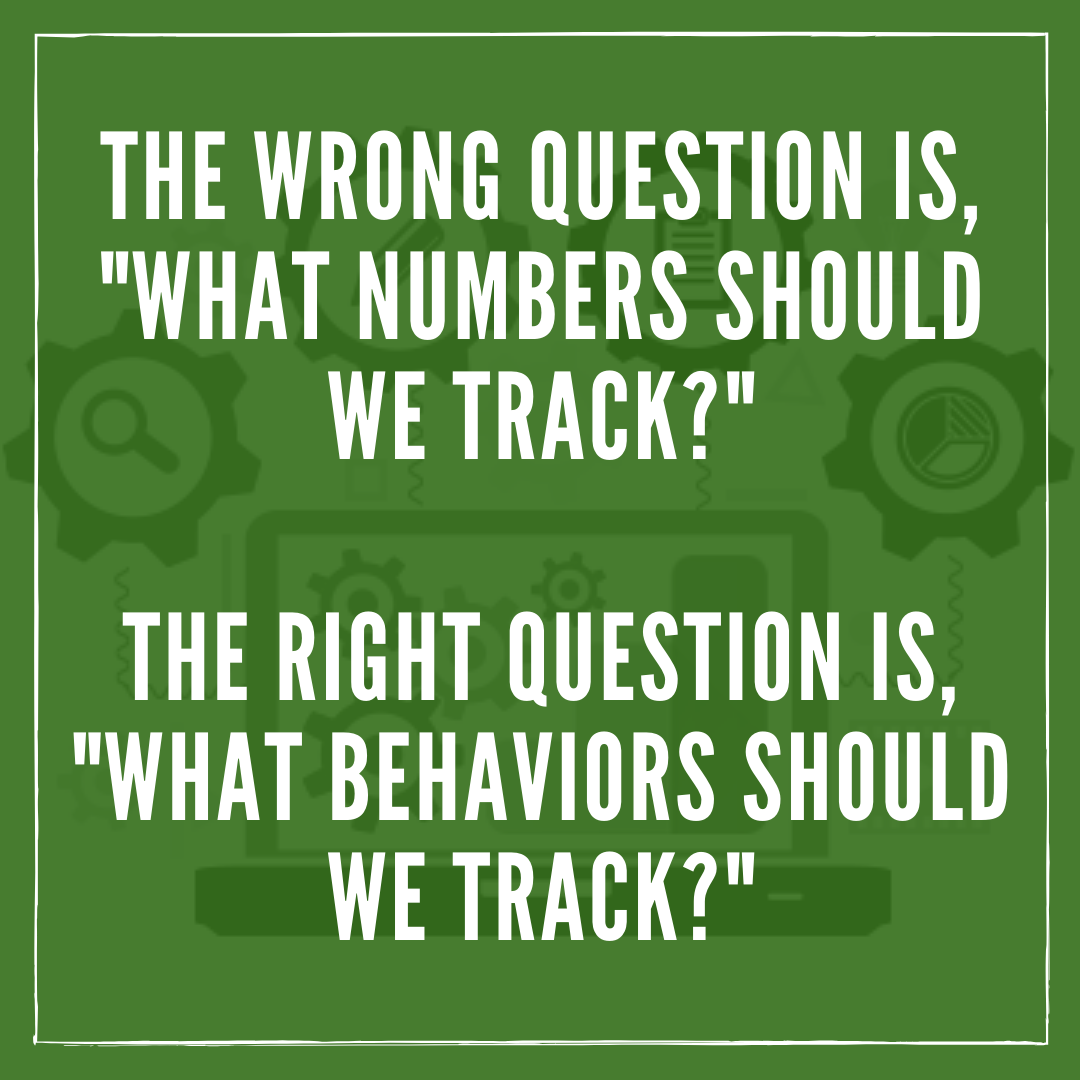
The wrong question is, “What numbers should we track?”
The right question is, “What behaviors should we track?”
The process of tracking behaviors begins at the planning stage of the measurement marketing process.
Use the Q.I.A. method to find the right behaviors to track on your site.
Question – What question am I trying to answer?
The questions you might answer are: Are my Facebook ads engaging my audience? Do visitors know where to go when they get to my home page? Where are they going after reading my blog?
There may be some number-focused questions, as well. For instance, you may want to know how many conversions came from your latest Google Adwords campaign. Either way, start with the questions that will drive meaningful action.
Information – What information do I need to get that answer?
You need to plan to grab the correct information to find the answers to your questions. You can find this information in the Funnel Visualization and Goal Flow reports used to figure out how your visitors move through your funnel. You may need UTMs to track the visitors coming from ads or emails.
Focus on the information that shows your visitors’ behavior, not just information for information’s sake.
Action – What action will you take when you answer the question?
Action is the most critical piece. If you can’t take action based on the answers to your questions, then they aren’t good enough. Ask questions that lead to action.
When using Google Analytics, look past the numbers and see the behaviors they represent.
Letting the Numbers Show the Behavior
Even while using behaviors to make decisions, you’ll still need to show numbers and measure where things stand with your prospects and customers.
However, don’t measure vanity metrics like pageviews, users, or sessions. Instead, measure the behaviors you want to know.
Core conversion rate and step conversion rate are two metrics made to show behavior.
The core conversion rate is the conversion rate on the primary objective. For example, your CCR could be the conversion rate on an email opt-in or purchase. That’s the “end” of the journey.
There are multiple steps on the way to the final result. Instead of measuring only the CCR, measure the conversion rates, or Step Conversion Rate (SCR), of each step in the customer journey.
You can use the SCR and CCR to build a complete picture of behavior. A trend may develop of visitors moving through two steps and then stopping. When you see a sharp drop in SCR on the third step, you know what you need to optimize to get better results.
When you only measure the CCR, you’ll have only part of the story. You need the entire story to make clear decisions.
Tell Your Story and Know Why You’re Successful
There aren't any templates or fill-in-the-blanks we can give you to decide what you should measure. Every company must go through the process of discovering what is important to them and how to measure it.
Here are the steps to get started measuring for behaviors and not for numbers.
The first step is to get a clear idea of what behaviors you need to track. Create a plan by using the Q.I.A. process.
- What questions do I need to answer?
- What information do I need to answer those questions?
- What actions will I take when I find the answer?
Once you have that plan in hand, write down precisely what you want to see. Then define every step needed to get your answer.
Once you begin measuring every step of the customer journey, you'll naturally pay attention to the behavior of your visitors and not only a final result.
(NOTE: Need help with measuring your prospect's and customer's behavior? Get the Marketing Behavior Toolkit inside as part of your free “Toolbox” membership to ensure you're sending the Right Message To The Right Person At The Right Time. The toolkit includes: the Behavior Blueprint, Behavior Maps, examples, and actionable insights.)

